

Interactive map: See probability of encountering COVID-19 at event where you live
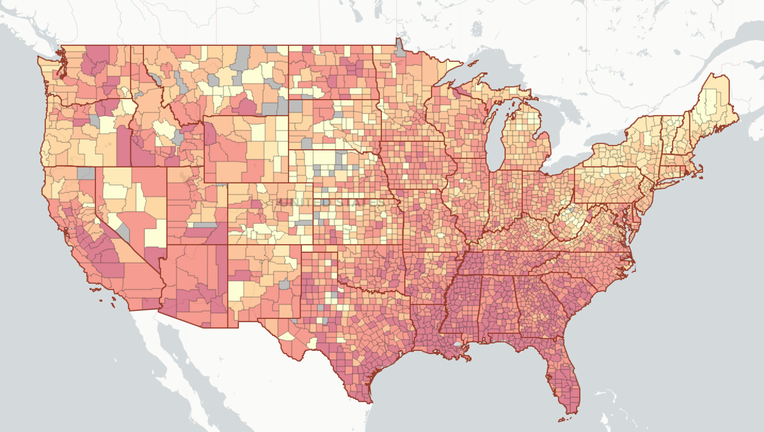
Georgia Tech rolled out a COVID-19 Event Risk Assessment Planning TooL that allows people to see the likelihood of them coming in contact with someone who has the virus. ( Georgia Institute of Technology, Biological Sciences)
OAKLAND, Calif. (KTVU) - Researchers at Georgia Tech created an interactive map that shows users the chances of encountering someone with COVID-19 at an event.
The assessment tool gives a glimpse of the risk level— the estimated chance (0-100%), that at least one infected person will be present at an event in your county, based on the size of the event, experts said.
For Alameda County, the map yields a 78% chance of coming in contact with someone COVID-19 positive. In San Francisco County, there is an 84% likelihood, and in Santa Clara County, a 79% chance.
The interactive map uses real-time data from the Atlantic's COVID-19 Tracking Project which collects data from state and territory public health authorities.
Click here to see the probability for your county.